The NQ Liquidity Map
Price does not move randomly. It moves between two kinds of liquidity — hunting one, reacting at the other. Once you can see both, you stop being the liquidity and start trading with the money that takes it.
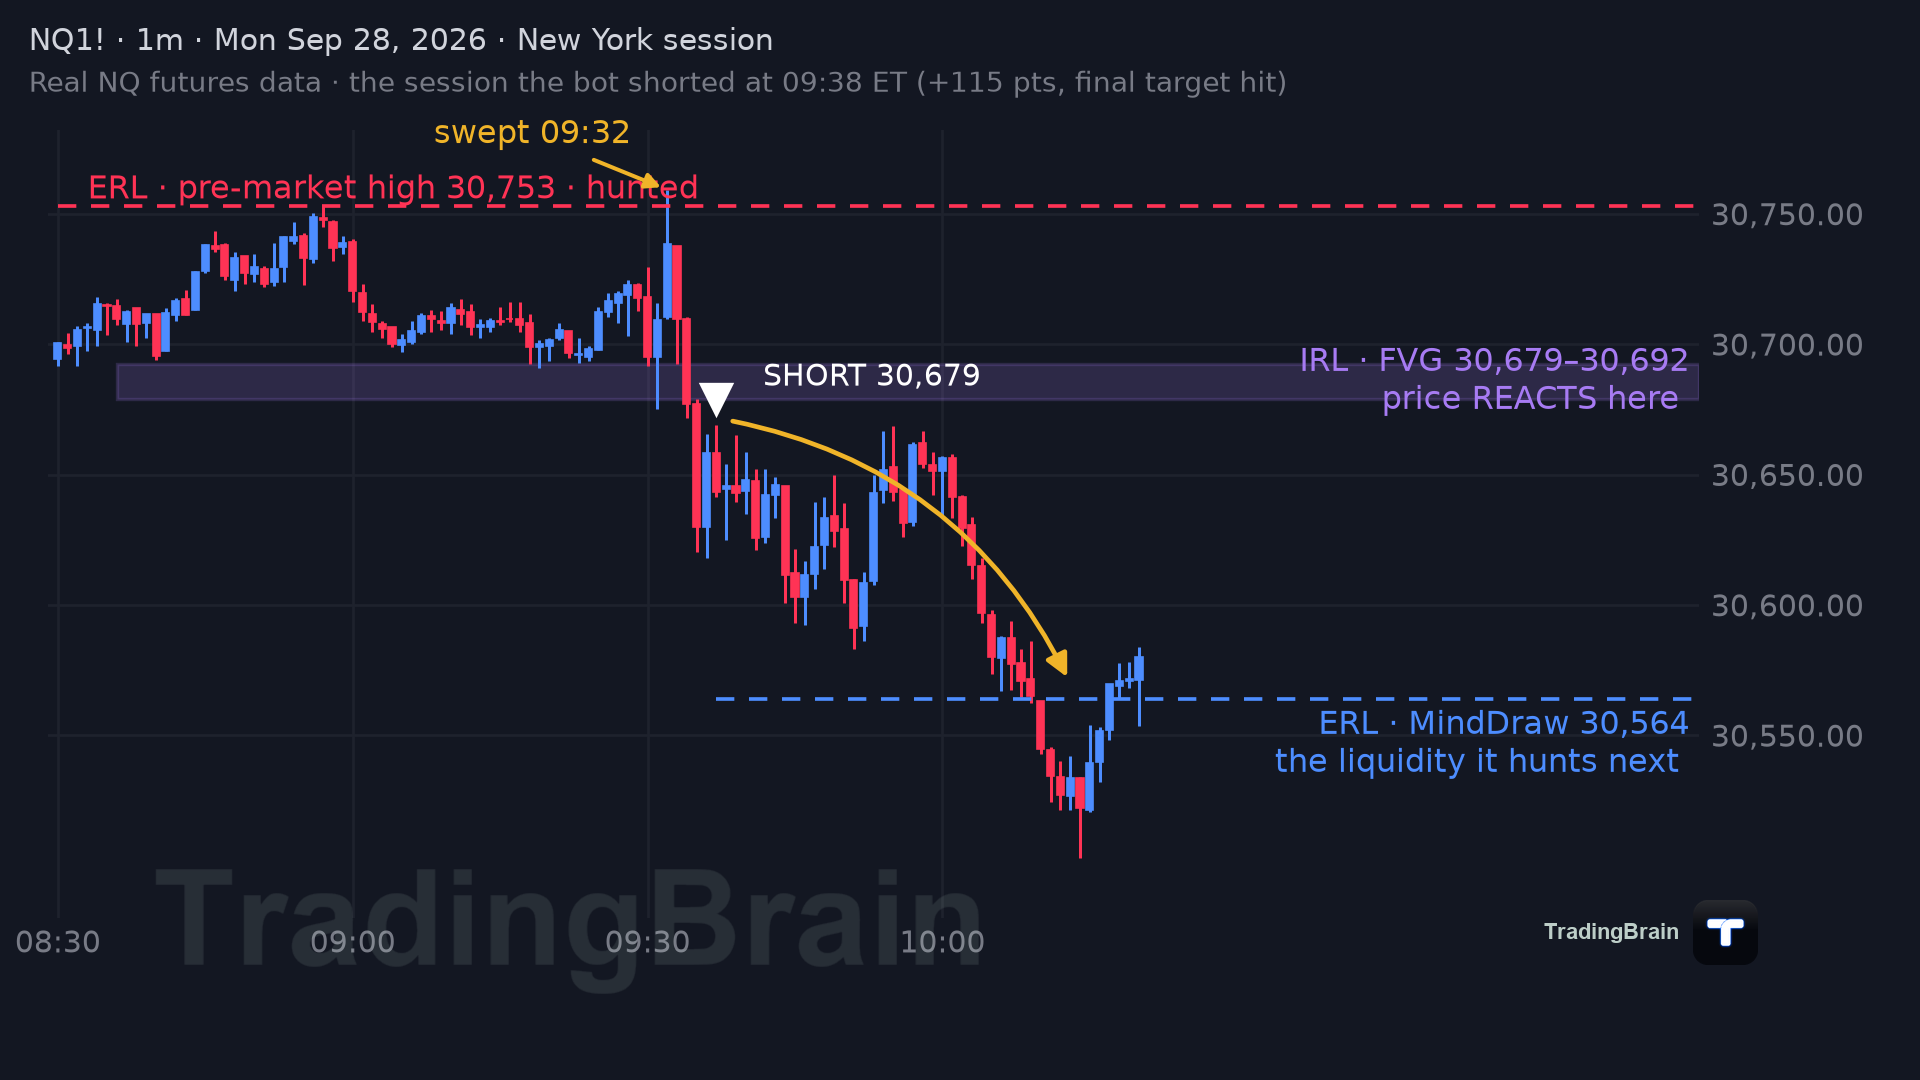
1 ERL — where price HUNTS
External Range Liquidity: the obvious highs and lows. Previous day high/low, the Asia / London / New York session extremes, the clean swing points. This is where the crowd parks its stops — and price is drawn to collect them. It doesn't "break out." It goes to take the resting liquidity, then turns.
2 IRL — where price REACTS
Internal Range Liquidity: the imbalances left behind. Fair Value Gaps and Order Blocks — zones price left "unbalanced" and tends to return to fill before continuing. This is where you enter — inside the range, not at the extreme.
Name the two levels before the session: the ERL price is hunting toward, and the IRL you'll enter from. The trade is just price traveling between them.